
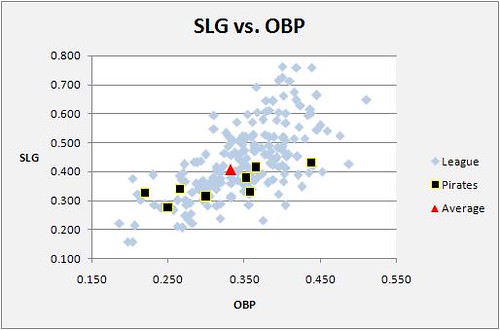
In an effort to ignore the new level of misery that the Pirates’ pitching staff sinks to on a daily basis, I will take a moment to focus on just how bad the team’s offense has been. I have graphed all qualified MLB hitters on the following scatter plots. In the first chart, I used slugging percentage (SLG) and on-base percentage (OBP), the two most important offensive statistics. In the second, I took the concept a little deeper, using Isolated Power (ISO), which is slugging percentage minus batting average, and walk percentage (BB%), which is simply walks divided by plate appearances. In both situations, this removes batting average from the equation, giving us a purer measure of power and on-base ability. The league as a whole is marked in blue, the eight starting Pirates are in black and gold, and league average is indicated by a red triangle. Enjoy.
The positive outlier in this graph is Andy LaRoche, who has posted an impressive average with a solid walk total to this point.
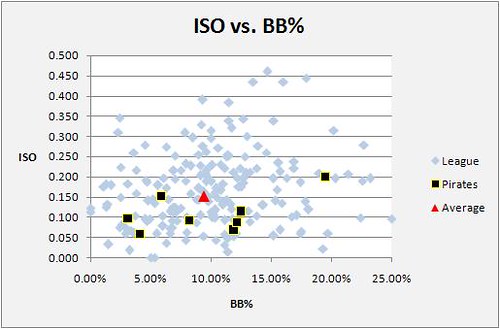
Garrett Jones is a man among boys on this chart. He has hit for a great deal of power, while drawing a considerable amount of walks hitting in front of Ryan Doumit. His low batting average is hurting him right now.
The majority of the lineup is simply below average at this point.
