

In the Kevin Correia thread over at Bucs Dugout, a long discussion broke out today about PETCO Park’s effect on Correia’s 2010 numbers. After reading through the debate, I decided to see what I could figure out.
Correia allowed 20 home runs in 145 innings in 2010, despite a well above average groundball rate. This is especially odd, as PETCO Park is notorious for suppressing home runs. StatCorner’s home run factors for PETCO are 59 for left-handed batters and 95 for right-handers. That makes sense considering PETCO’s dimensions.
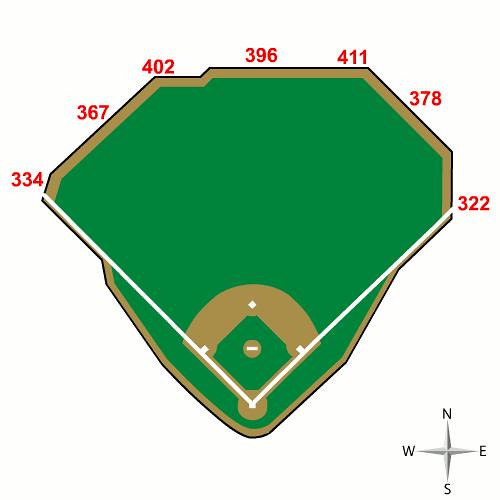
PNC Park is much less forgiving in right field, which does not exactly bode well for a right-handed pitcher who struggled to keep the ball inside PETCO’s spacious confines. Let’s check the spray charts to see if Correia would have allowed more home runs if he pitched in PNC Park.
Katron.org provides a useful tool that displays MLB Gameday hit locations in any MLB stadium. So we can take every batted ball that Correia allowed at PETCO Park in 2010 and show its hit location at PNC Park. Here is each batted ball that resulted in an out.
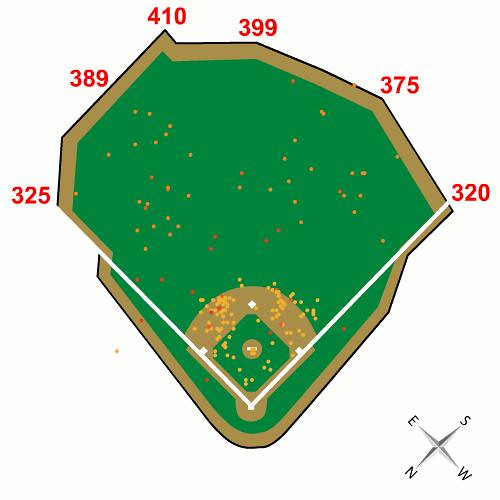
As you can see, there is nothing of any great interest here. One fly ball was caught right where the PNC Park right-center field wall would have been located. Other than that, all batted balls were well within the outfield walls. In other words, San Diego outfielders were not tracking down 400-foot warning track shots when Correia was on the mound. Next, let’s look at all home runs Correia allowed at PETCO Park.
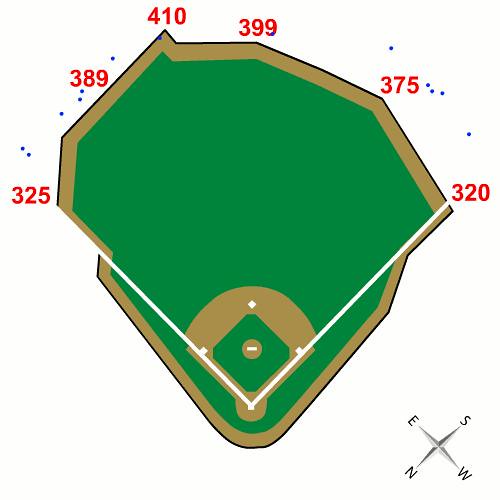
Again, nothing too interesting. One home run at PETCO probably would have died in PNC’s Northside Notch in left-center field. All other home runs would have easily cleared the PNC Park boundaries. Next, let’s look at the hits allowed by Correia that were not home runs. Things are about to get interesting.
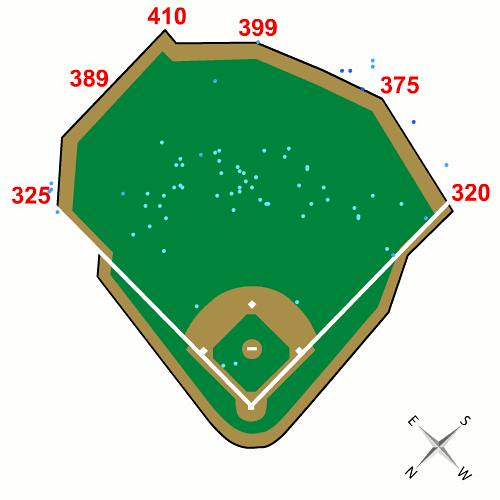
As many as 12 batted balls seem to have landed at or behind PNC Park’s outfield wall. Obviously, 12 additional home runs would have destroyed Correia’s season stats. But there is a flaw in this data. Each of these points indicates the location in which batted ball was first touched by a fielder, not where it first hit the ground. Thus, if a ball is lined into the right-center field gap and picked up by the center fielder after it comes to a rest at the wall, the hit location is recorded as being on the warning track. That very well could be the issue here. Most of these 12 batted balls were recorded on or near the PETCO Park warning track.

Fortunately, we do not have to stop here. We can go to the video. So I went back and checked out the highlights. By my count, about four or five of these batted balls landed on the PETCO Park warning track and probably would have cleared the PNC Park fence. A few example replays are at the bottom of this post.
Despite an already high home run rate at PETCO Park in 2010, it appears the park actually saved Correia about four or five additional bombs. Of course, it is difficult to separate park effects from random variation. Over 14% of Correia’s fly balls cleared the fence in 2010, and these additional home runs would have upped that total to around 18%. That is unsustainable, and well above his career rate of 10.1%. So even though PETCO probably saved Correia from a few home runs, that does not necessarily mean his home run rate will spike even higher when pitching at PNC Park. Simple regression to the mean will likely compensate for the venue switch, at least somewhat.


